By the Numbers: Apartment Rent Growth vs. Wage Growth
-
 by Douglas Paul Real Estate
 - April 25, 2018
- Business
- 1

What a difference a decade makes! The economy has bounced back, employment is on the rise, and a construction boom is creating new housing in cities from coast to coast. All great news.
In fact, the economy is doing so well that it’s driven housing prices to record highs. Both rents and sales prices are approaching record highs, particularly in places like Boston, where strong market fundamentals continue to attract investors of all kinds.
As rents have ticked higher and higher, more households have become what’s called “rent-burdened,” spending 30% or more of their income on rent and utilities. Yes, the economy is strong. Yes, people are working. Yes, we’ve reached record low unemployment. But there’s concern that people aren’t earning enough to afford increasingly high rents. Census data show that the share of rent-burdened households climbed from 45.7% in 2005 to 48.9% in 2010.
So, should we be alarmed? Maybe. Most people jump to that conclusion. But let’s dive a bit deeper.
Apartment Rent Growth vs. Wage Growth
According to the U.S. Bureau of Labor Statistics, average salaries and wages have increased 2.5% per year from 2009 through 2016.
This is generally on par with, and somewhat higher, than the inflation rate during that period. Inflation peaked in 2011 at 3.0%, but in five of the eight years analyzed, inflation was less than 2.0% – dipping as low as 0.7% in 2015.
Some have fared better than others. Those employed in high-paying industries have experienced more wage growth than those with mid- and low-level paying jobs. Wage growth for high-earning individuals has often exceeded 3.0% per year, whereas wages for those at the other end of the spectrum have occasionally risen by less than 1.0% per year.
On its own, this data doesn’t tell us much. We need to then look at apartment rent growth.
Nationally, between 2009 and 2016, rents have increased by an average of 4.3% per year. Rent growth has been more pronounced in some markets than others. Rents in Seattle, Dallas and Portland, OR have increased at about twice that rate.
Rents have increased more or less depending on property type. Class A apartments have posted the steepest gains, including a whopping 6.1% gain in 2015 alone. Class BC rents increased more slowly between 2010 and 2015. For the past two years, Class BC rents have increased at slightly higher rates than Class A apartments – which could be explained, in part, by the influx of new Class A apartment buildings that have come online lately. The influx of Class A units has relieved some pressure on rents in this market segment.
The chart below is illustrative.
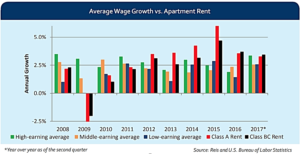
When taken together – average wage growth vs. rent growth – it’s clear that households fared better from 2008 through 2011, where wages were increasing faster than rents. This should come as no surprise. This is when the housing market crumbled and homes lost tremendous value.
But in 2012, the housing market began to recover. By 2014, it was in overdrive. This is when we start to see the steepest rent increases among both Class A and Class BC properties.
Looking Ahead: Cautious Optimism
There’s reason to believe an equilibrium is in sight. Rent growth began to taper in 2016 and continues to steadily decline.
As noted above, this is largely due to the recent construction boom. Several cities have also adopted ambitious housing creation goals: In New York, Mayor Bill De Blasio’s launched an initiative to create and preserve 200,000 affordable units by 2024. In Boston, Mayor Marty Walsh has pledged to help create 53,000 additional residential units by 2030—through various efforts, as we recently reported, that have put the city on track to meet that goal.
The creation of new housing, both public and private, should make rents more affordable to people in every income bracket.
We’re already starting to see this play out.
The number of rent-burdened households has finally started to decline. After topping out at 48.9% in 2010, this number fell back to 46.1% in 2016 – just 0.4% higher than the share of rent-burdened households back in 2005. This is an incredibly positive sign that cannot be overlooked.
Of course, apartment rent growth and wage data can vary drastically from one metro to another. Interested in learning more about the specifics of the Greater Boston area? Give us a call today


zoritoler imol
April 20, 2022 at 7:36 pm
You actually make it seem so easy with your presentation but I find this matter to be actually something that I think I would never understand. It seems too complicated and extremely broad for me. I am looking forward for your next post, I’ll try to get the hang of it!